
Analytics
Client analytics that drive value, retention & recurring revenue
VanillaIP Analytics, delivered through the Uboss platform, are built to help Partners move beyond basic hosted telephony by turning call recordings, call data, service activity, and billing information into clear insights. This allows you the Partner to demonstrate ongoing value, support data-led conversations with customers, and create new revenue opportunities around analytics, optimisation, and managed services.
Client Voice Analytics
Prove call quality, agent performance & customer experience
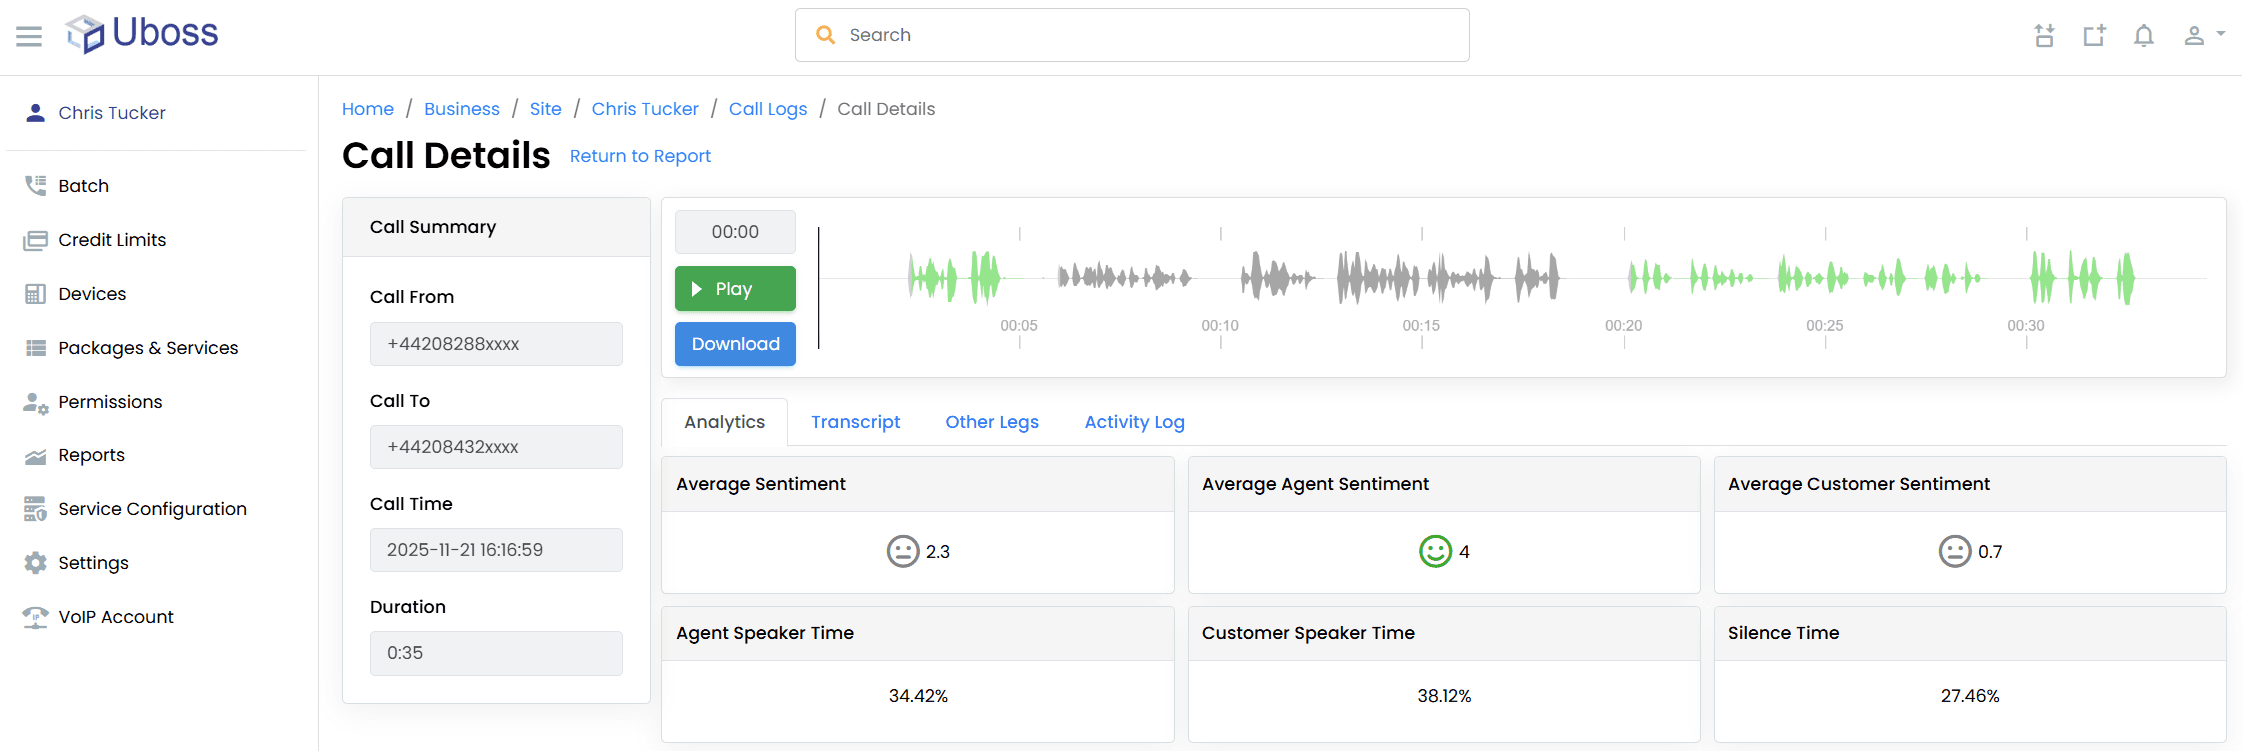
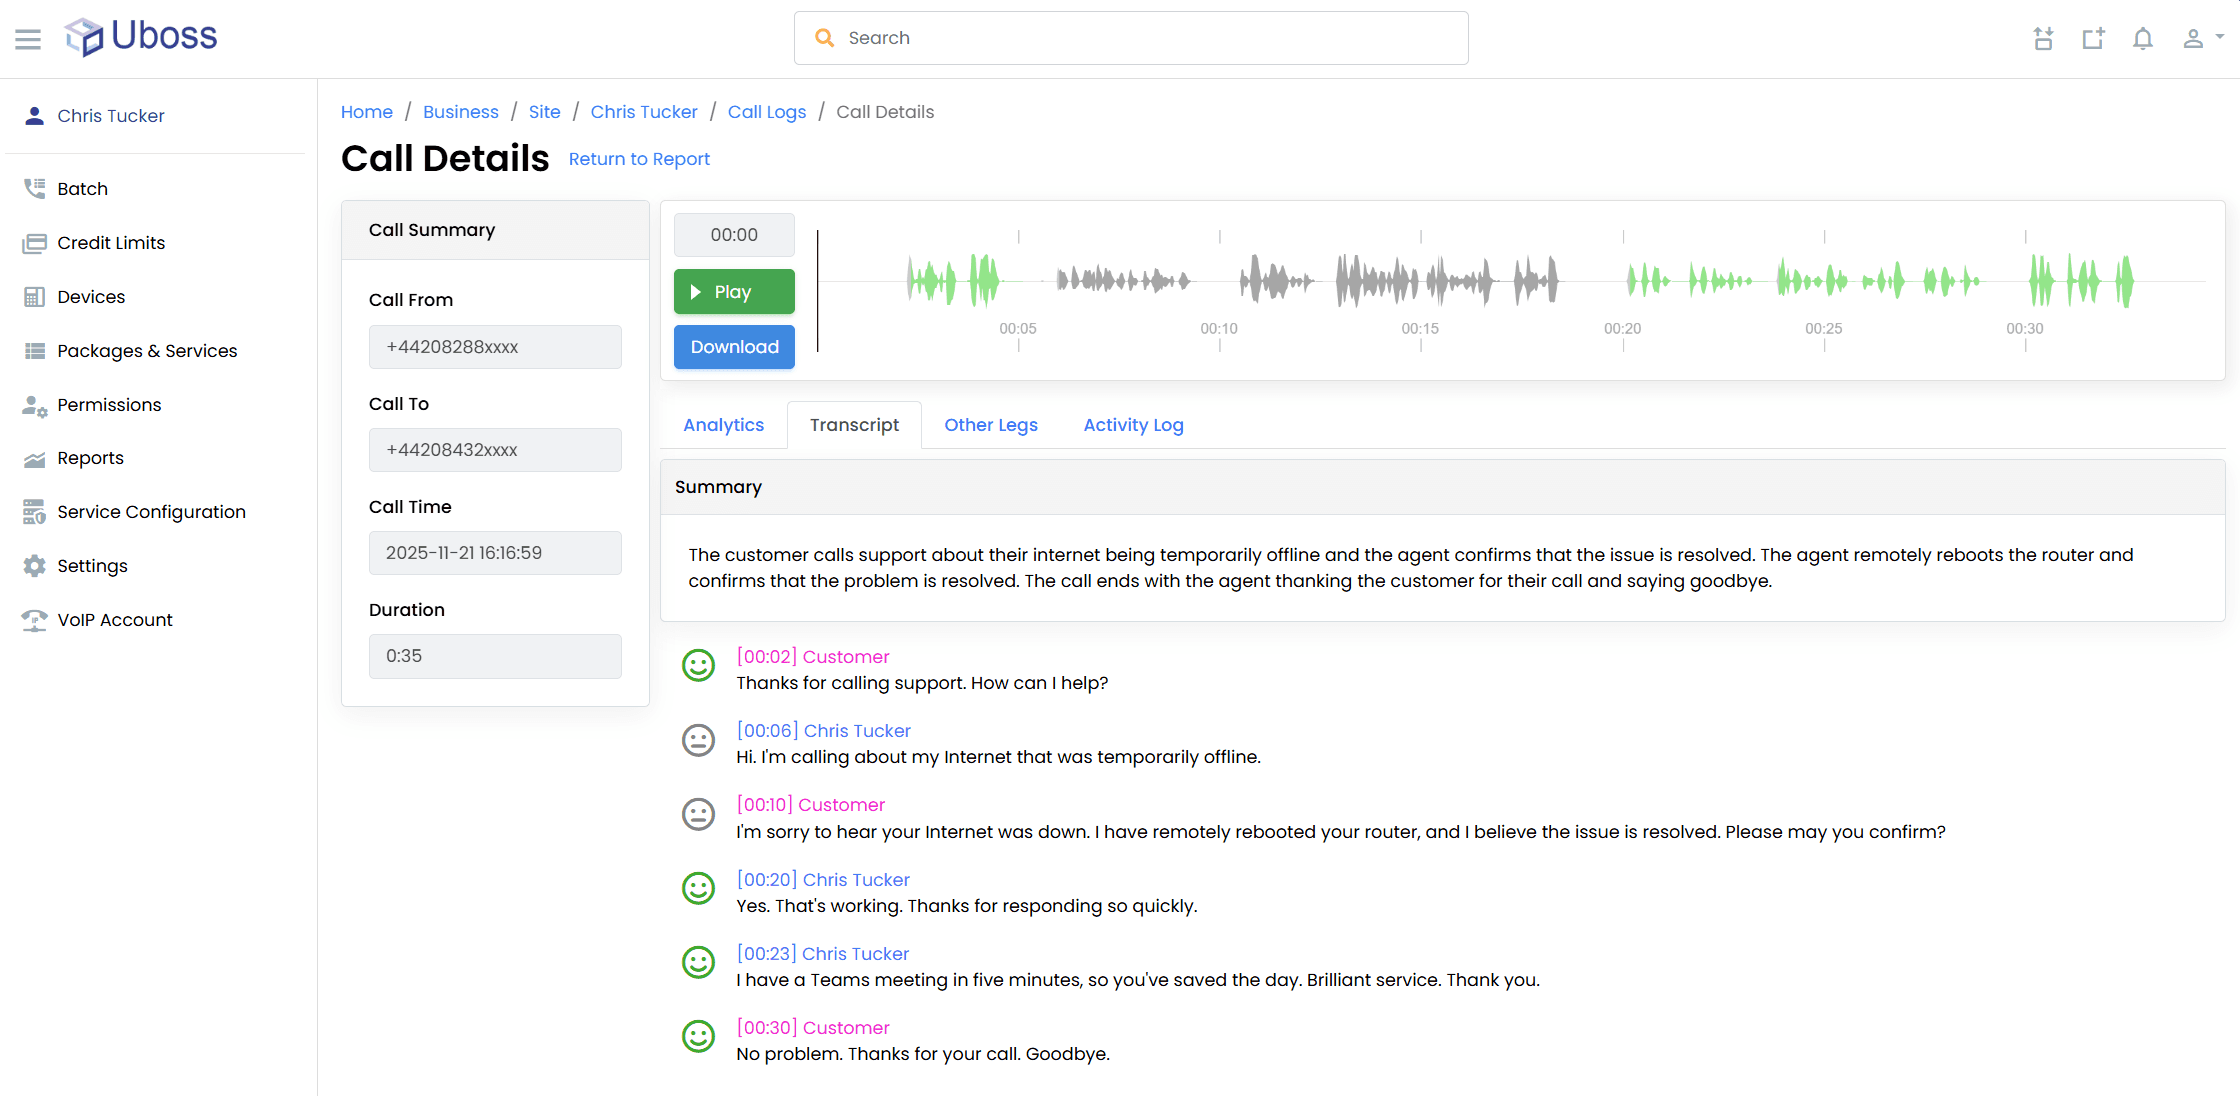
Transcription of call recordings, agent sentiment and call summary is the key behind Client Voice Analytics enabling customers to understand a whole new level of agent voice interaction in addition to existing traditional data reports such as call volumes, agent activity, and queue performance.
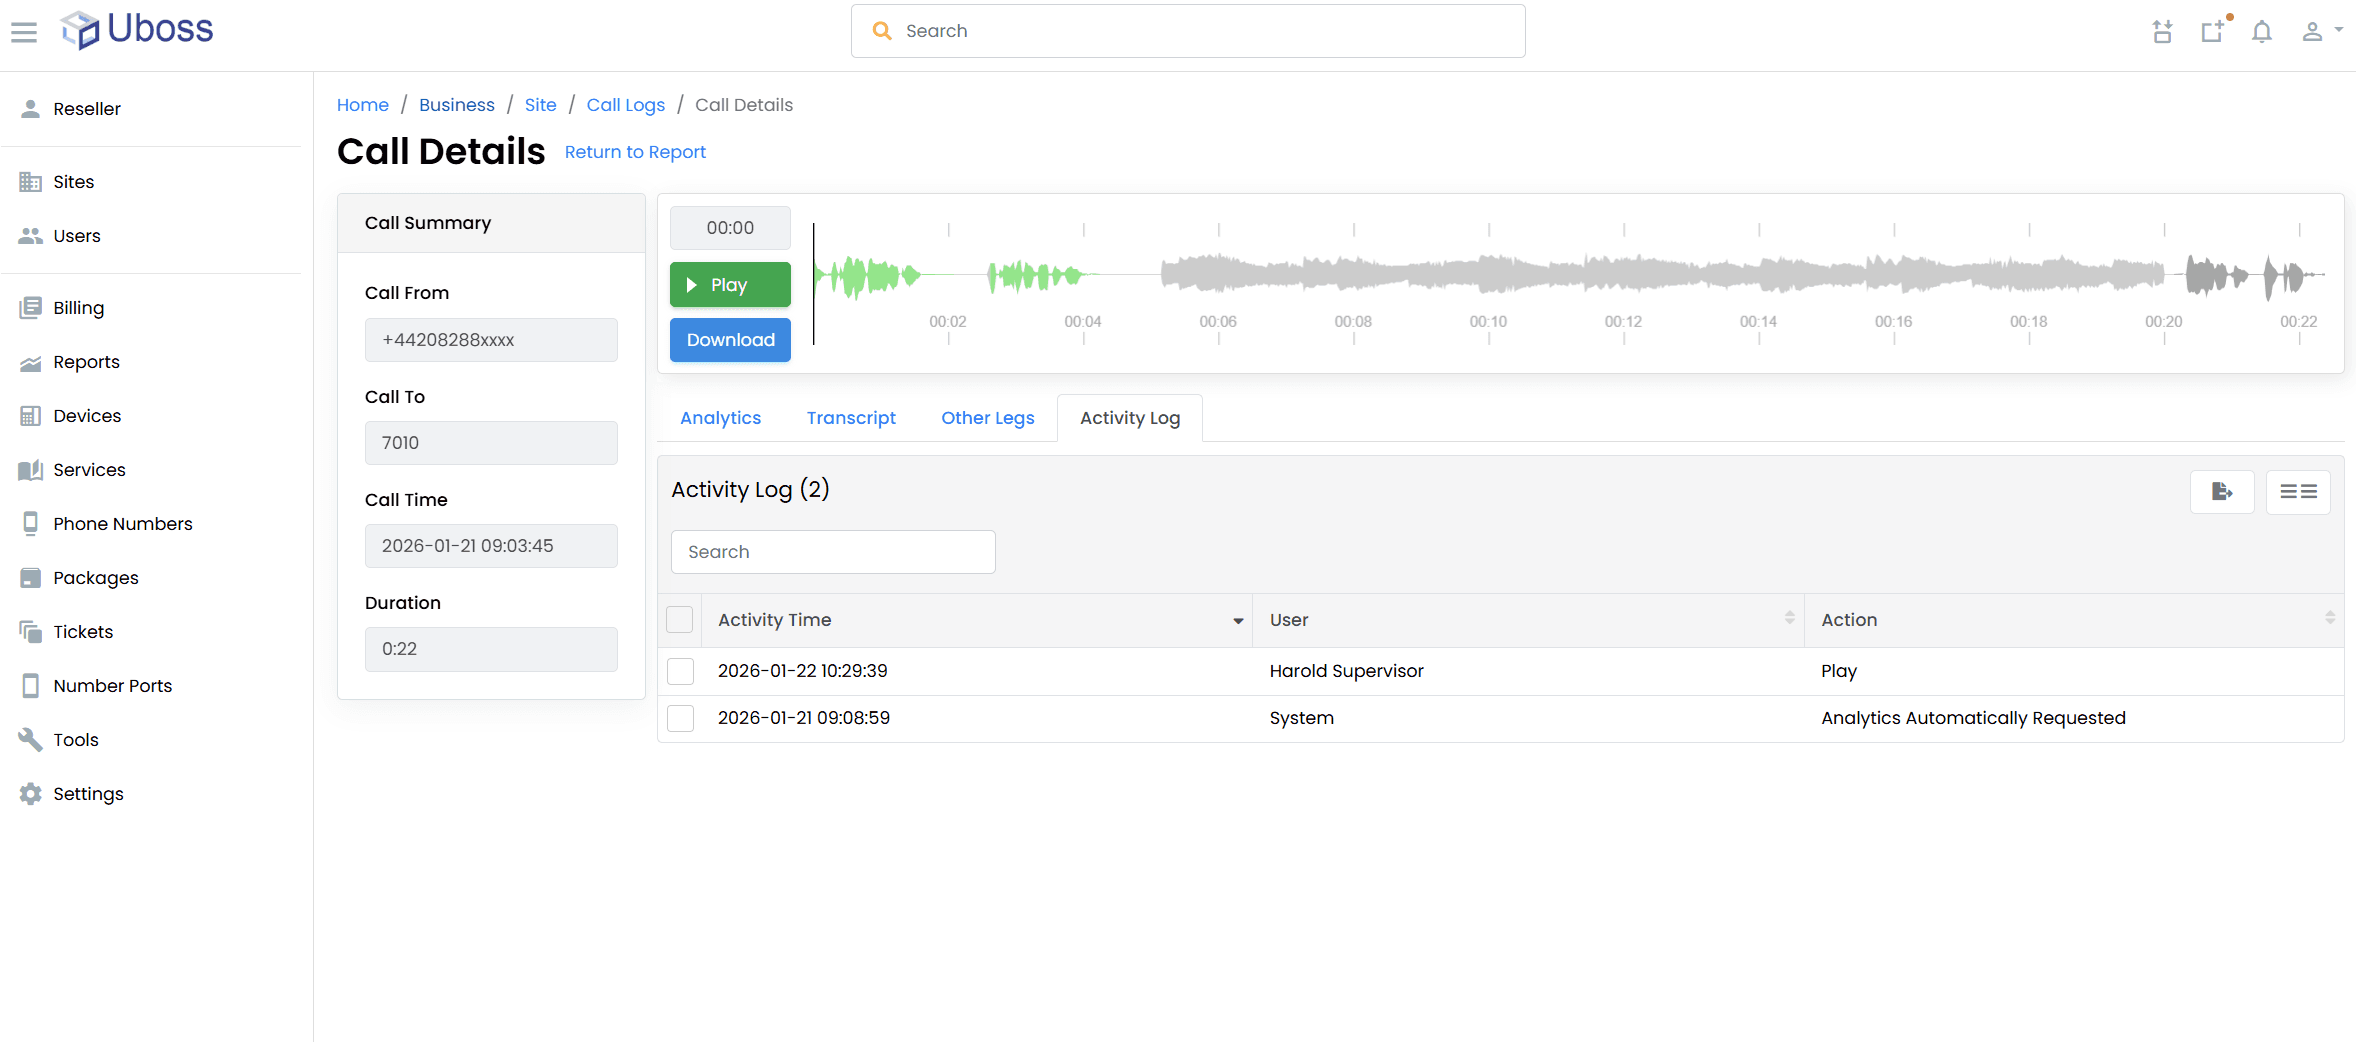
Voice Analytics data is available through both dedicated reports and integrated views, allowing recordings and transcriptions to be accessed directly from familiar reports such as call logs. This makes it easier to support quality monitoring, training, compliance, and customer experience reviews.
Reports and Playback options include:
Integrated Transcription and Call reports – Review reports with both call detail, time date duration etc. along with call transcription and sentiment recordings and transcriptions attached.
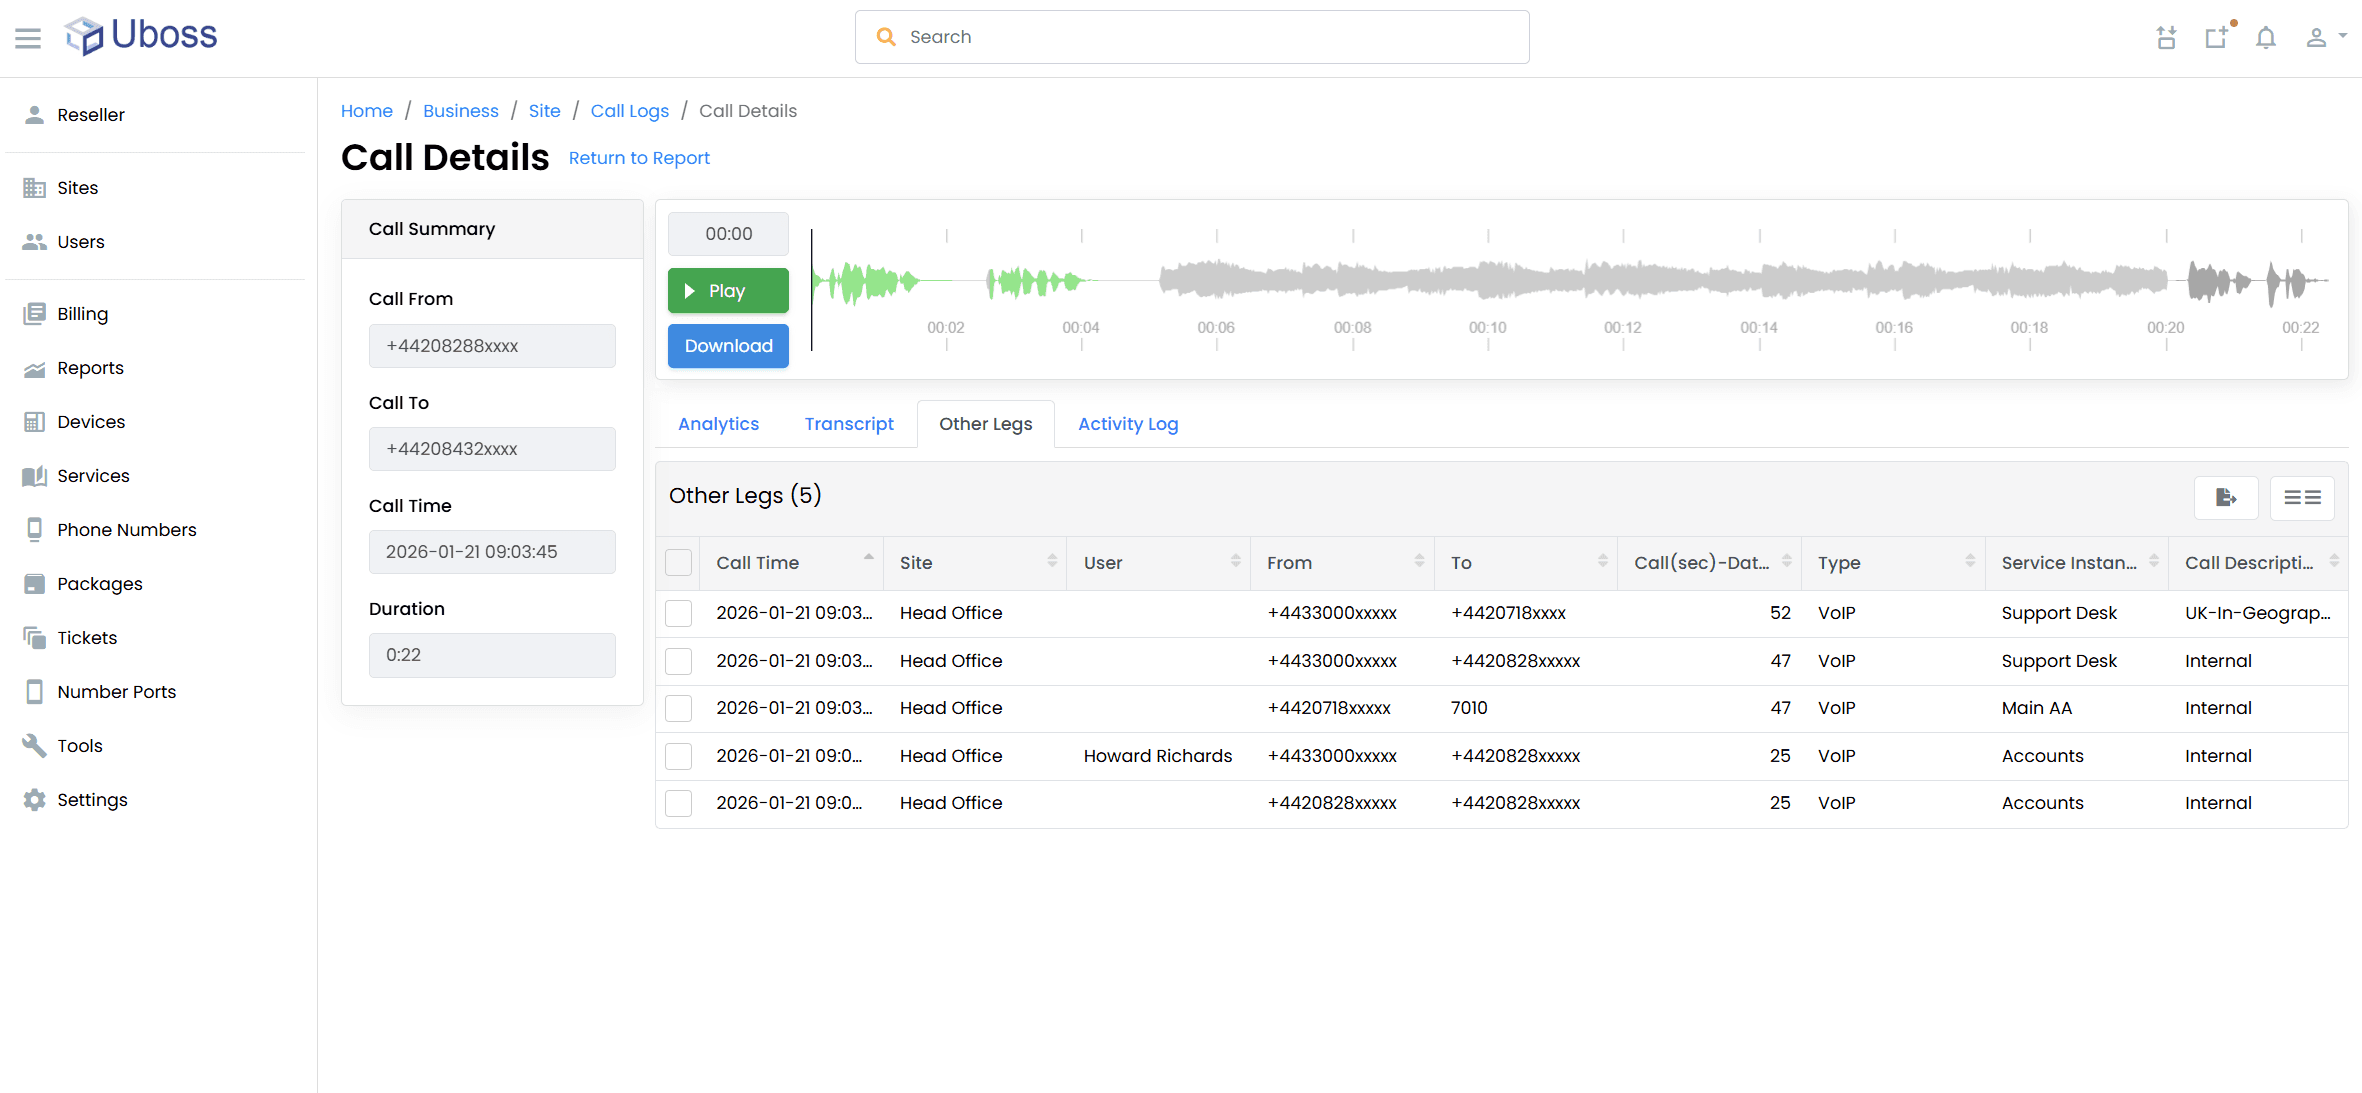
Call Leg Identification – using dual channel processing both calling and called party are clearly identified within transcription logs.
Call Sentiment score – all calls given a sentiment score between –10 and +10 (+10 being best), select calls on sentiment scores.
Automatic & Manual Transcription of recordings – Option to automatically transcribe all calls for example on support desk queue or on-demand.
And More….
Client Data Activity Reports
Demonstrate service usage and uncover optimisation opportunities
Client Data Activity Reports give Partners a clear, ongoing view of how customers are using their communication services across users, sites, and call flows. These reports help move customer conversations away from “what do we pay?” towards “how effectively are we using the service?”.
From high-level summaries to detailed operational insight, these reports support trend analysis, service reviews, and proactive optimisation. Report data is typically retained for up to 13 months and is included as standard, making it easy to build long-term insight without additional tools.
Reports include:
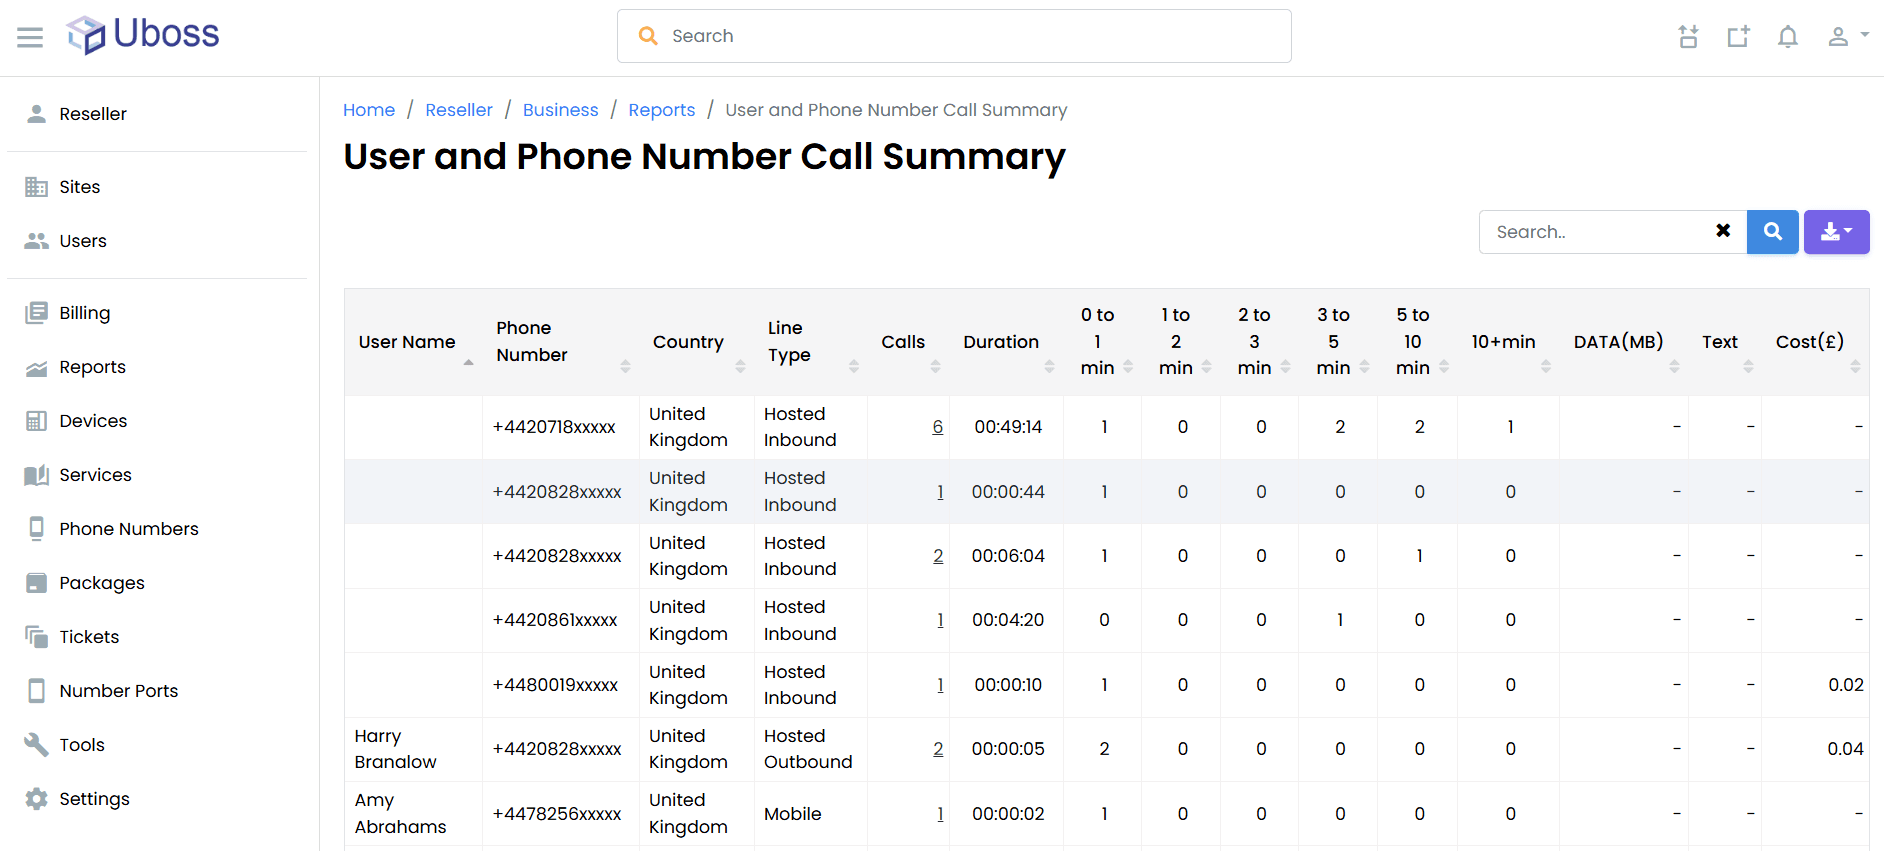
Call detail reports including calls from any device types including mobile, all in one place.
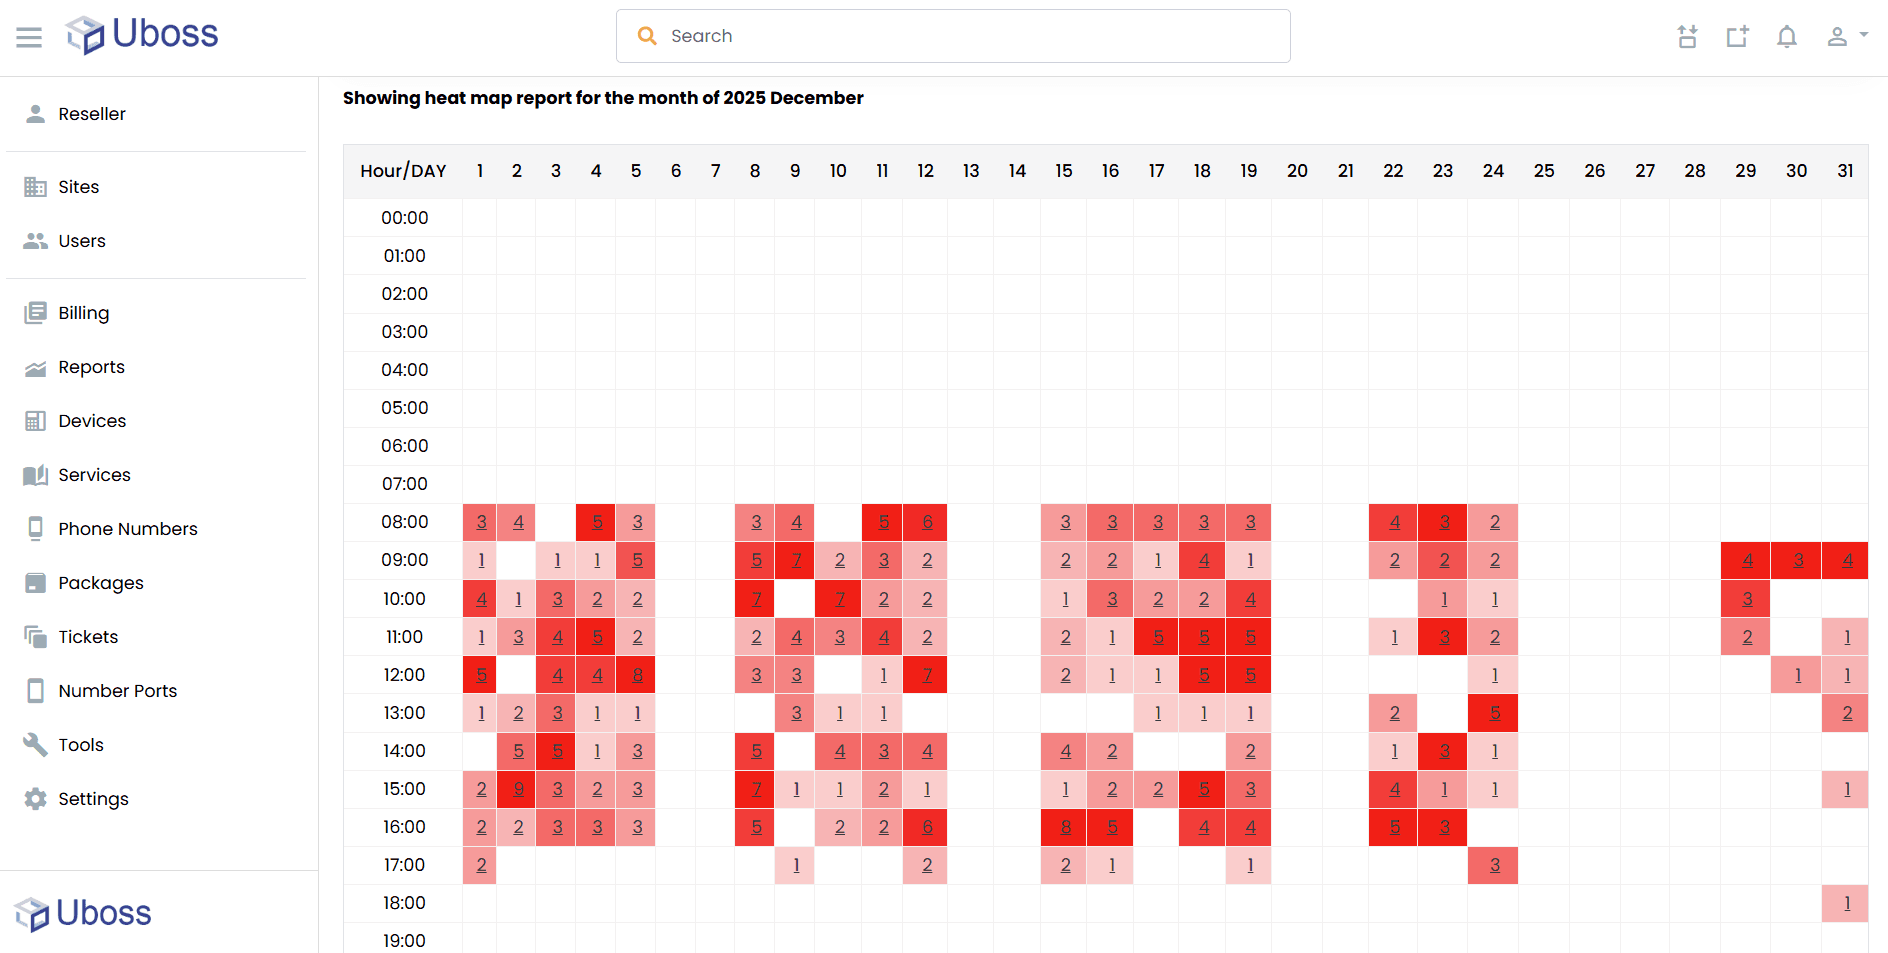
Heatmap – Visualise call demand by hour and day to optimise coverage.
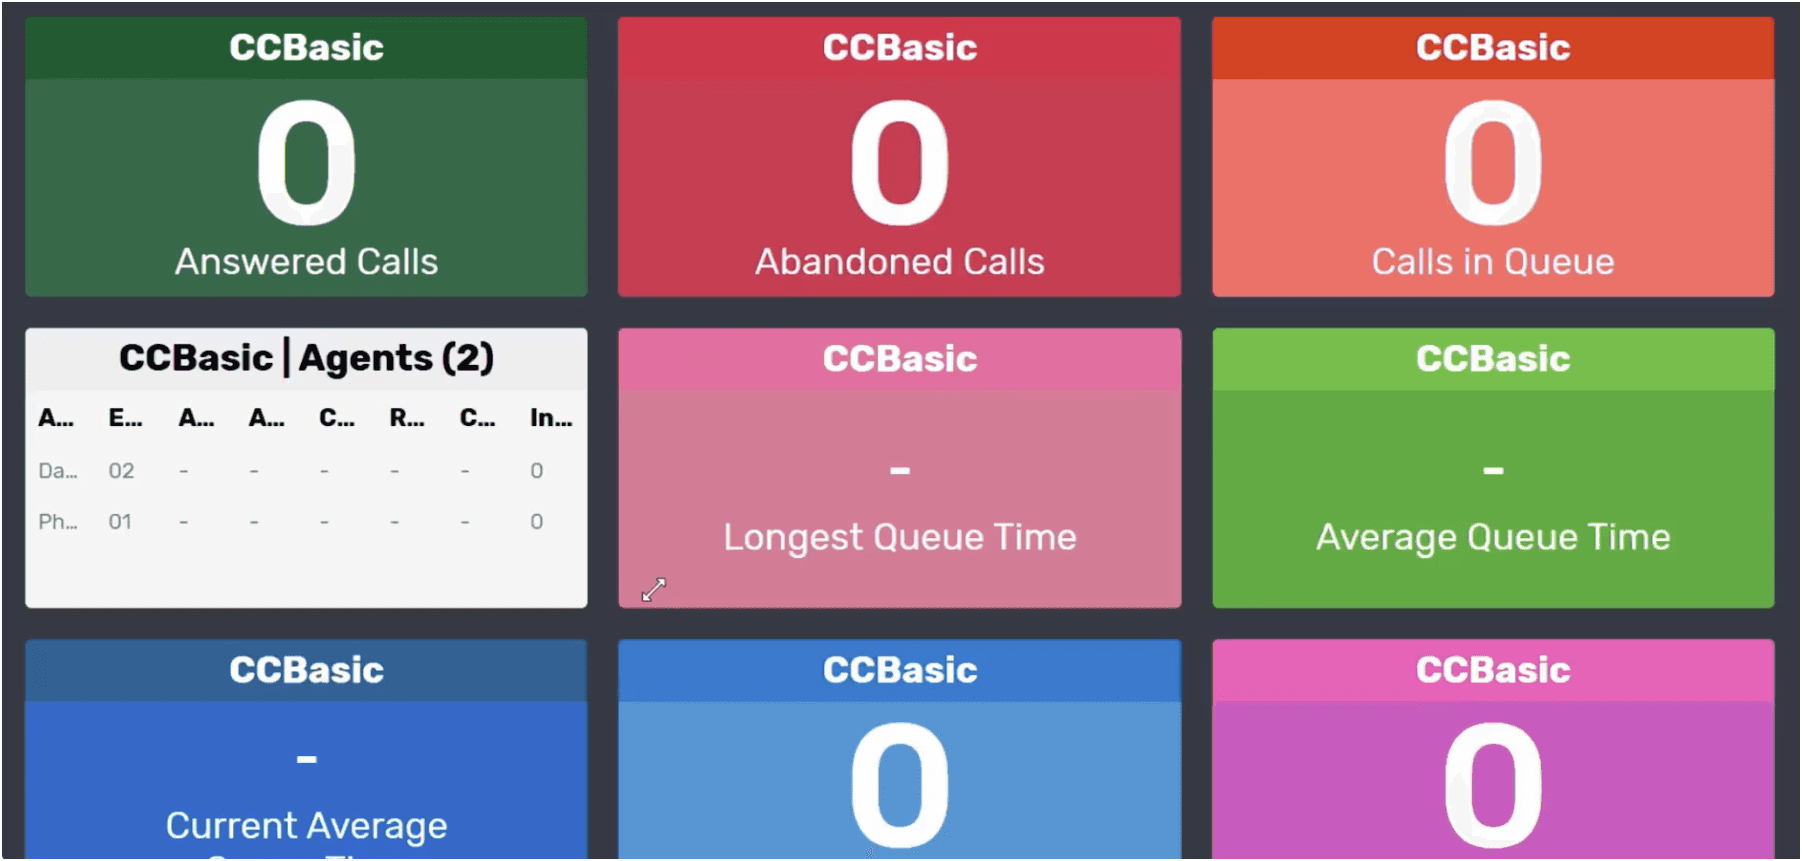
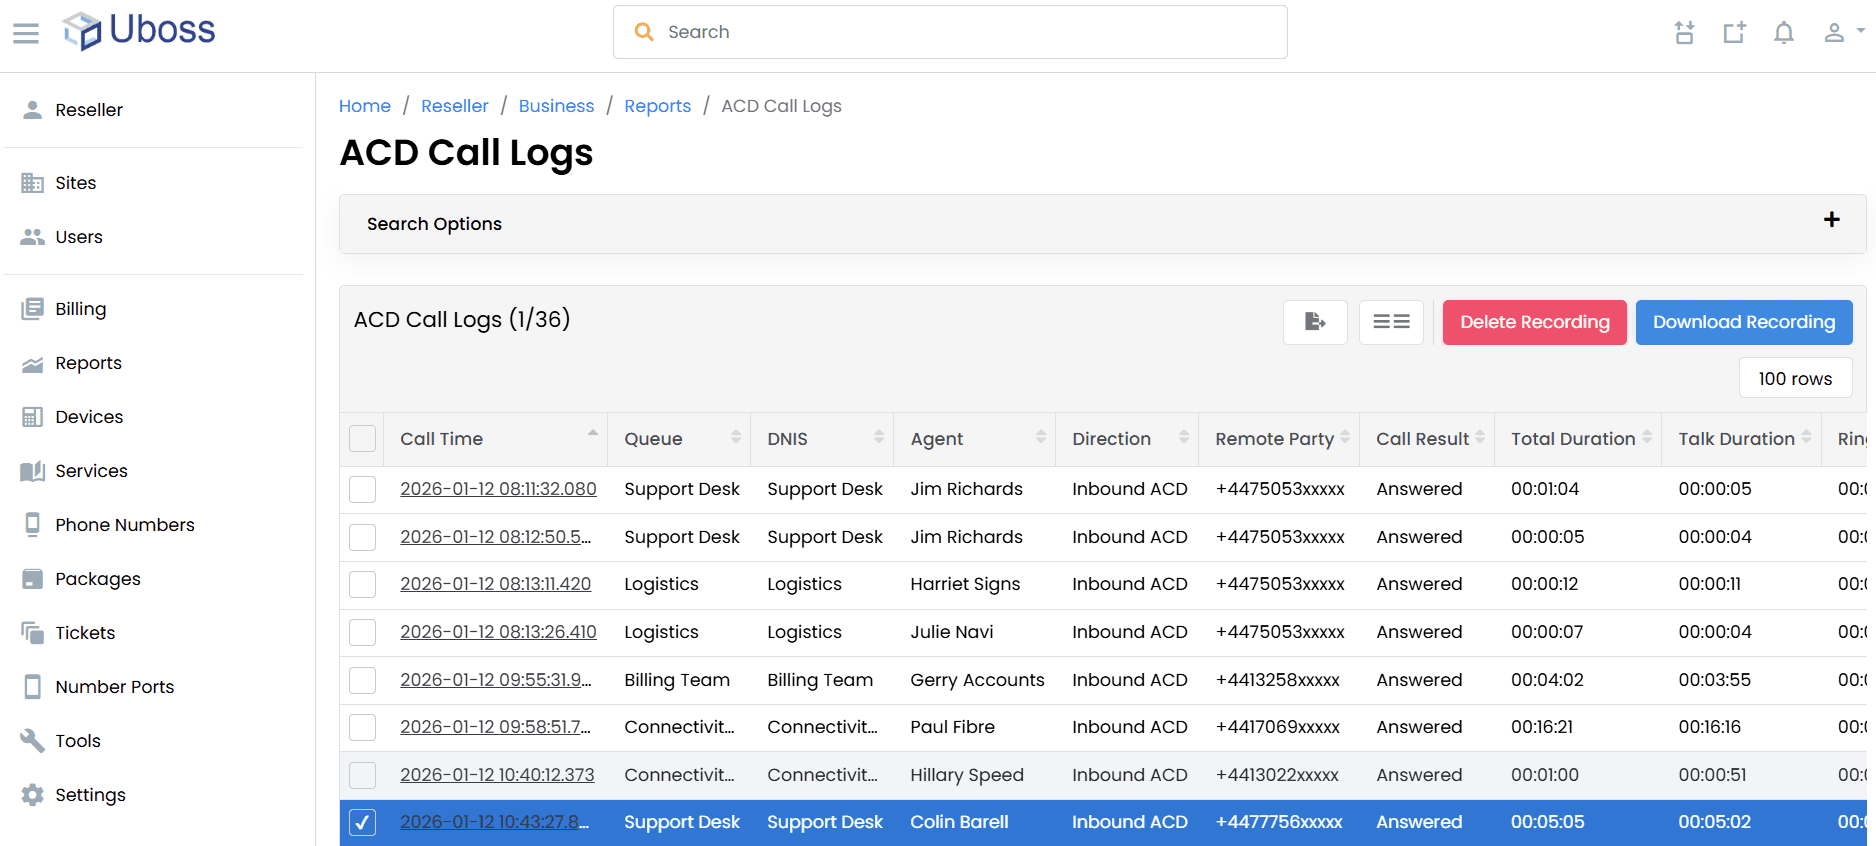
ACD Call Logs – Analyse queue traffic and call handling behaviour.
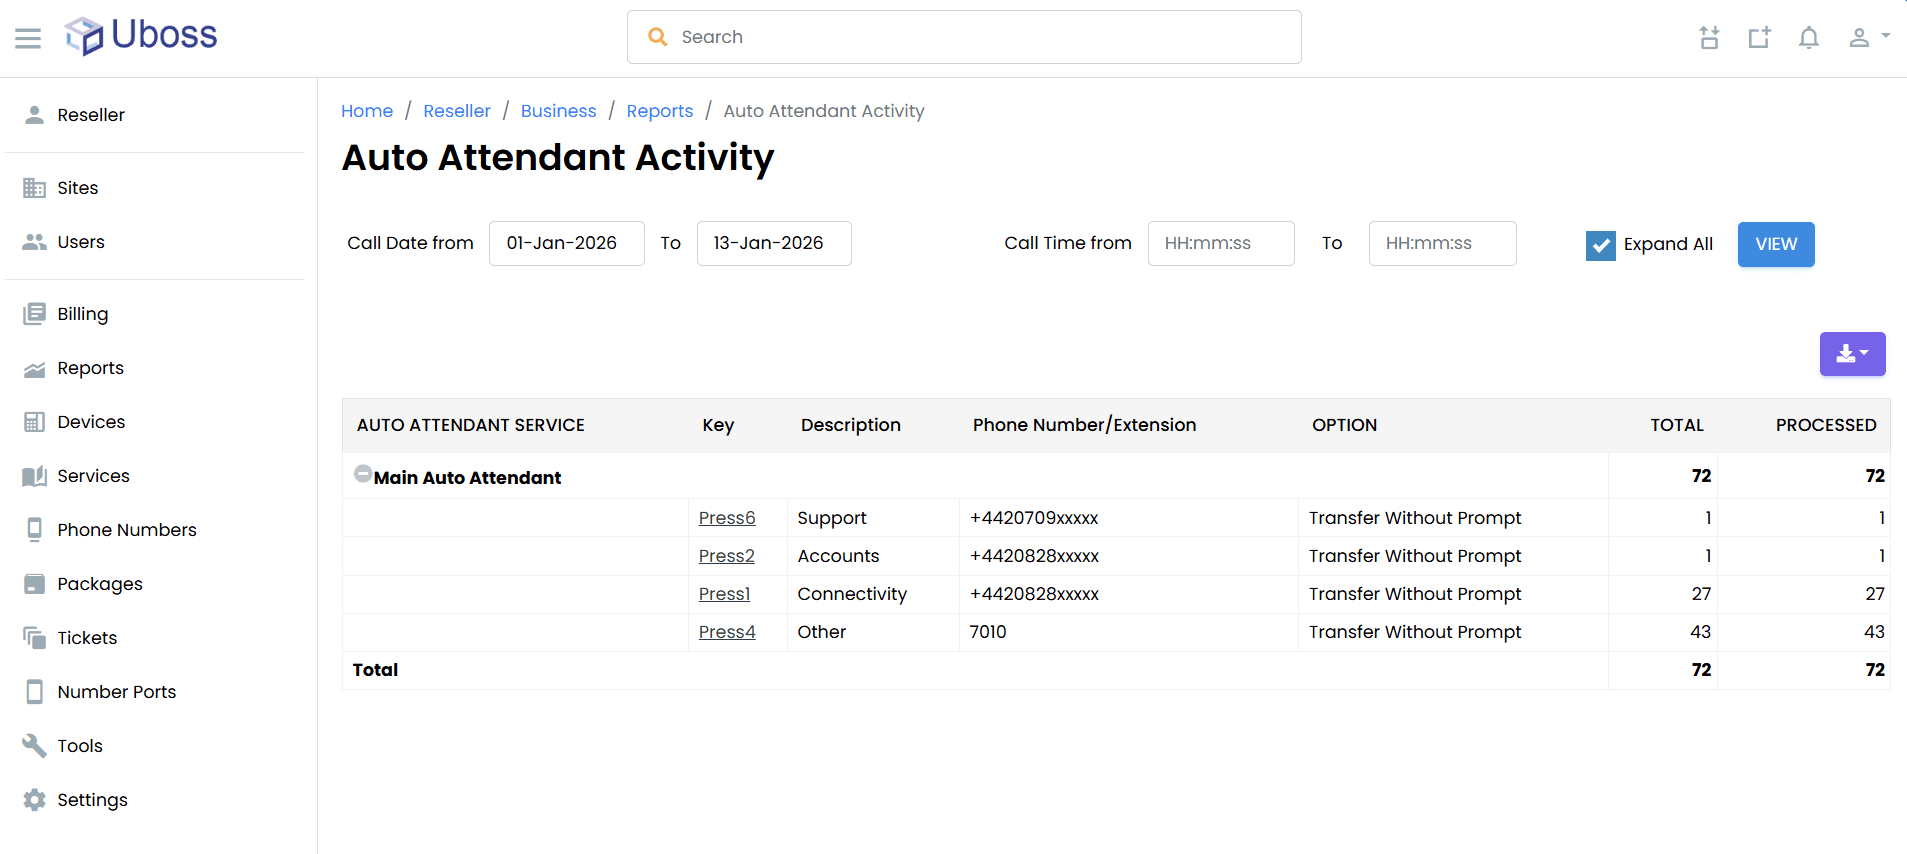
Auto Attendant Activity – Understand IVR choices and customer journeys.
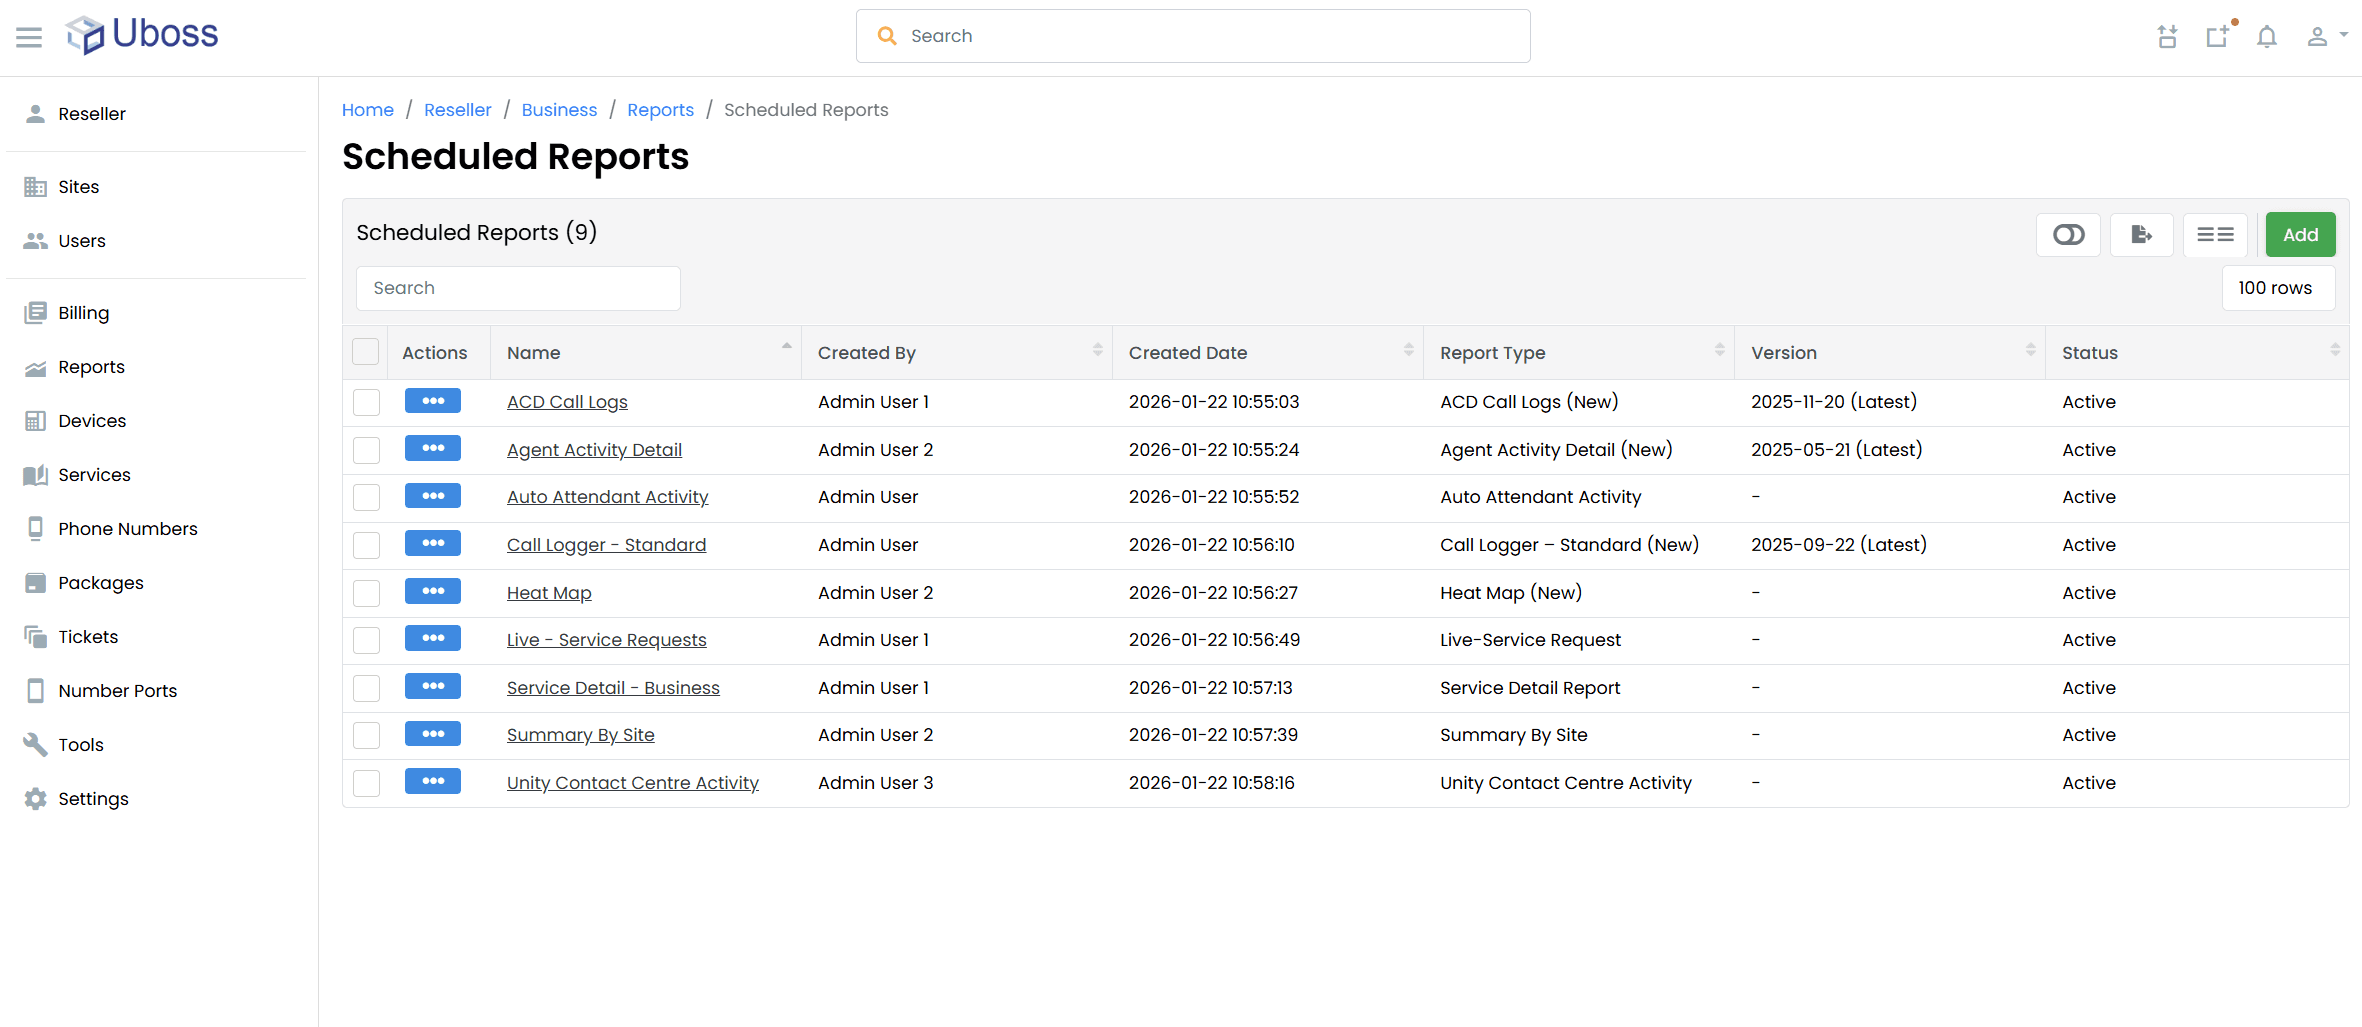
Scheduled reports – Run reports on demand or create a recurring report to include repeat regularity (daily, weekly, monthly) etc along with specific filters, i.e sales team only etc
And More….
Client Billing Reports
Provide transparent, usage-led billing insight
Client Billing Reports support clear and accurate billing conversations between Partners and their customers. For Partners using Uboss Billing, these reports link service usage and call activity directly to charges, presented in a way that is easy for customers to understand and reconcile.
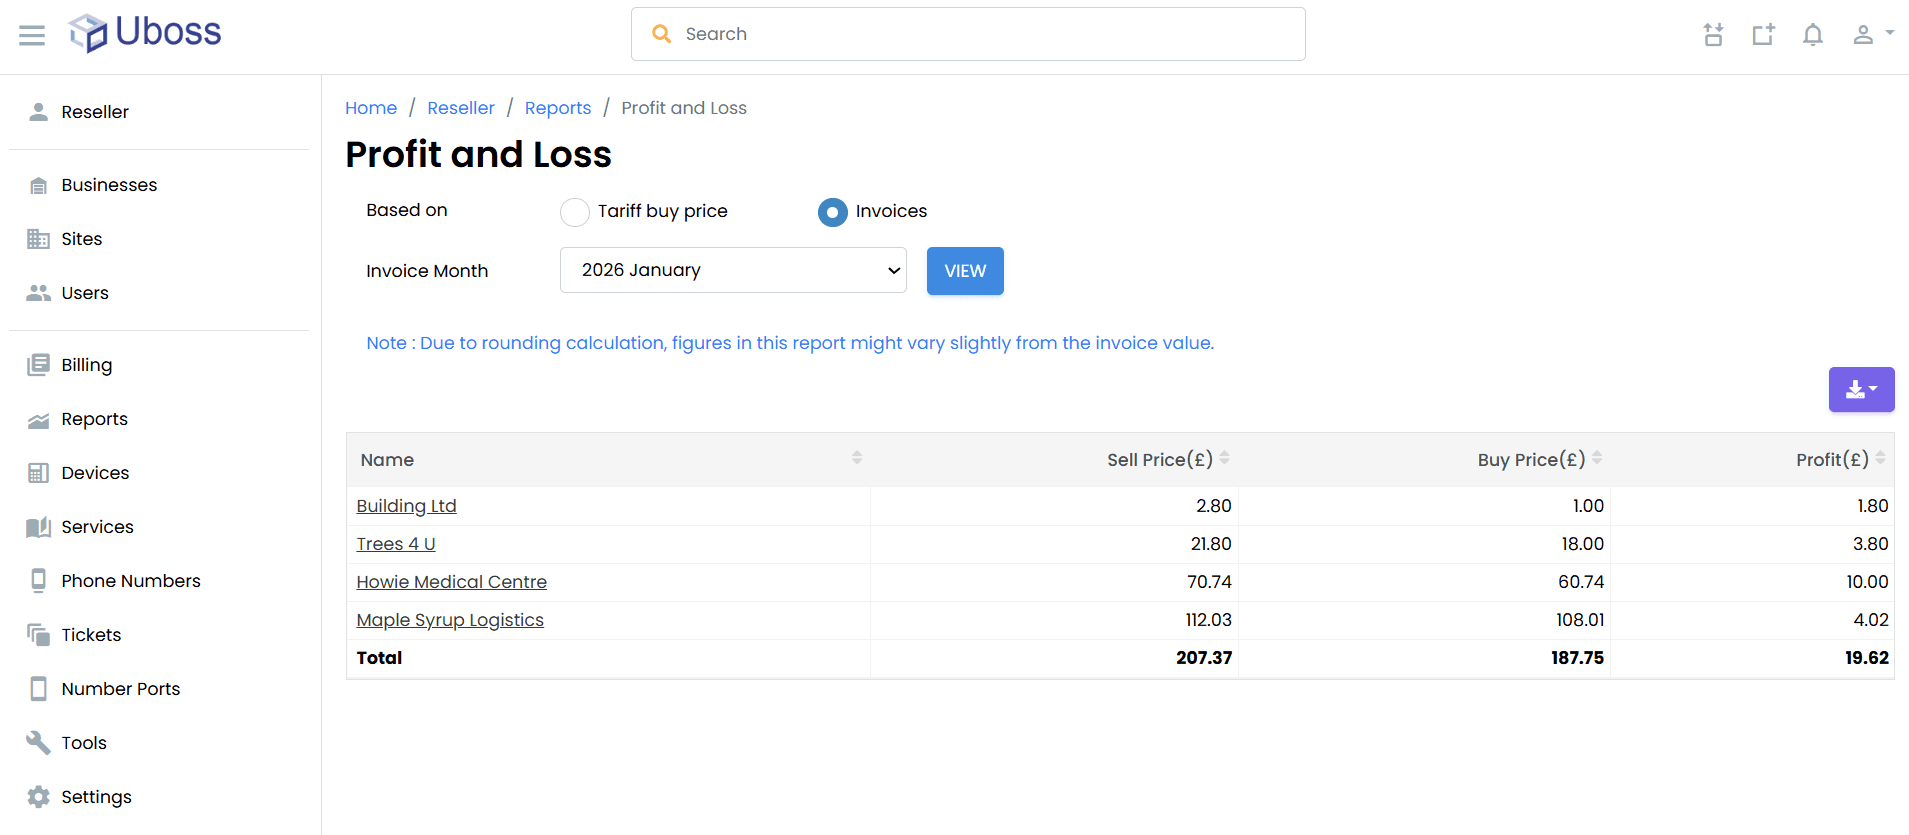
Reports are structured around users and sites, making them ideal for internal chargeback, cost recovery, and multi-location billing scenarios. For Partners, additional financial reports provide the insight needed to understand margin, track trends, and plan growth.
Reports include:
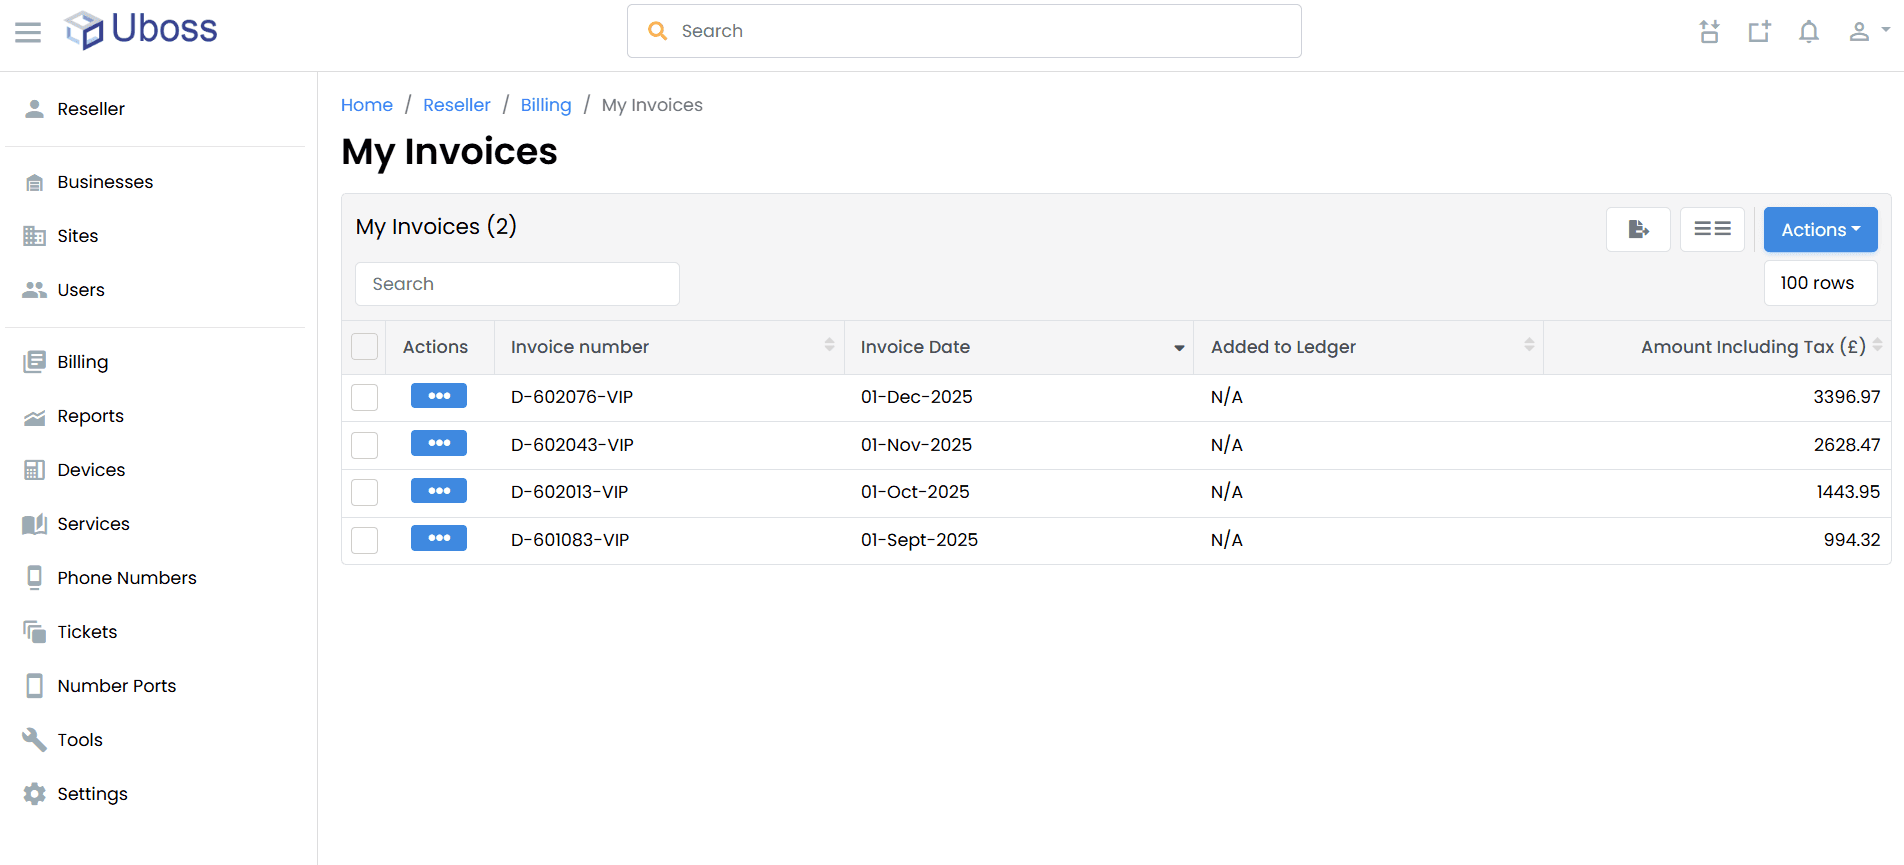
Sales Ledger - show client paid and outstanding invoices and credit notes.
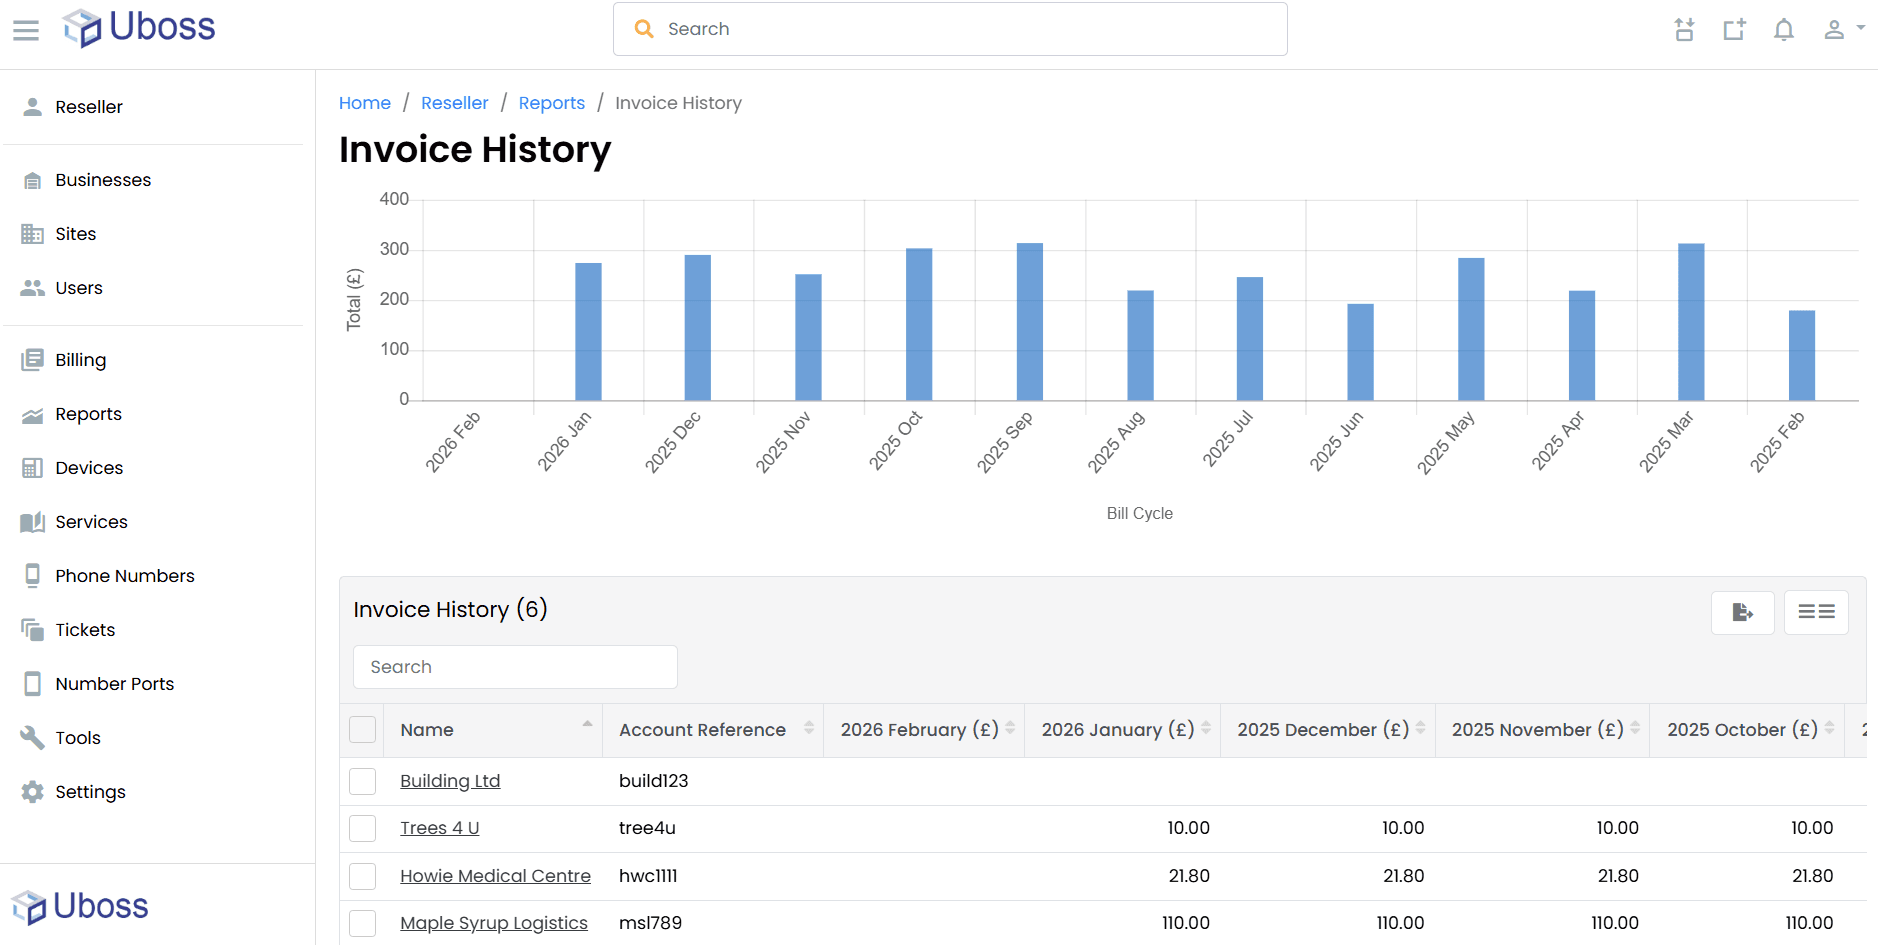
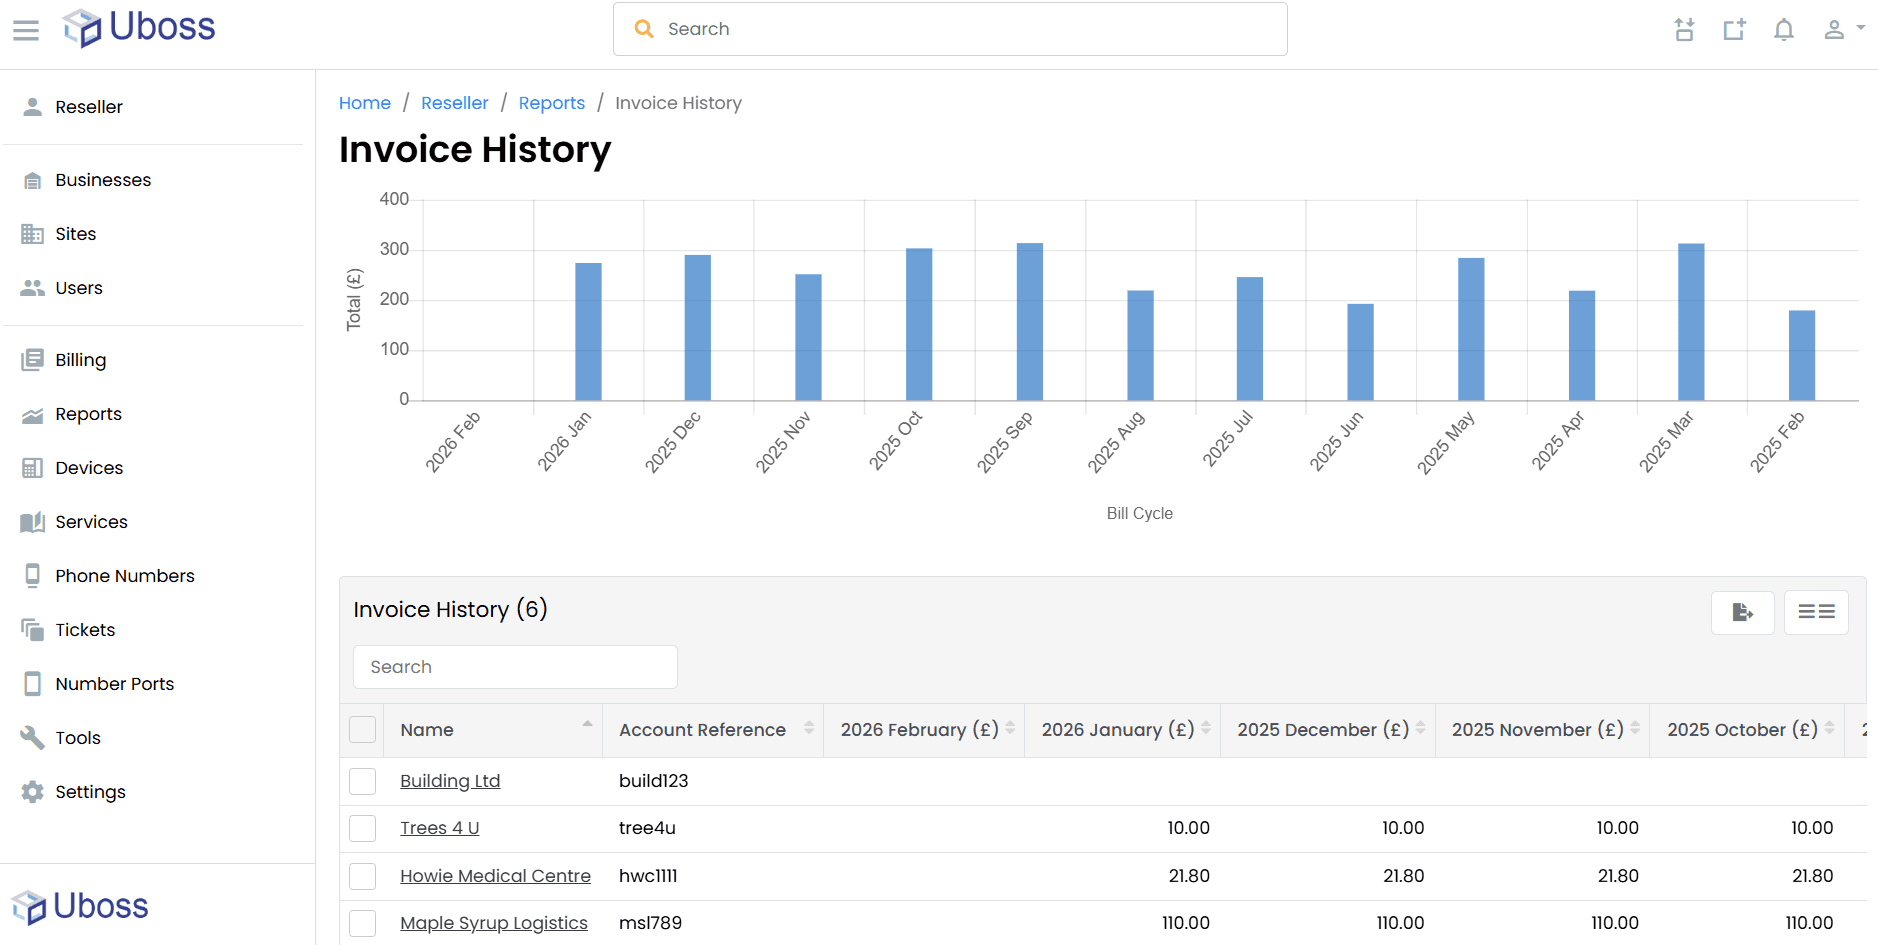
Invoice History – Track billing trends over time.
Service and Call Summary – Break down recurring and usage-based charges.
Site and Department based billing – easily allocate and charge services and packages against specific sites or departments to make intercompany recharging easy.
Phone Number Details – Attribute call costs to specific users or locations.
And More….

Why Uboss Analytics Matter
The communications market has shifted. Voice is no longer a differentiator, contracts are shorter, and customers expect measurable outcomes.
1
Create Differentiation
Most UCaaS offers look the same on the surface. Analytics give Partners a way to stand apart with measurable outcomes, not just features.
2
Reduce Churn
When customers can clearly see usage, performance, and improvement over time, the service becomes embedded in their operations, making switching providers far less attractive.
3
Enable Proactive Account Management
Analytics highlight usage trends, adoption gaps, and risk signals early. This allows resellers to act before issues become complaints or contract terminations.